auto-correlation and self-convolution
Contents
simple example
 |  |  |
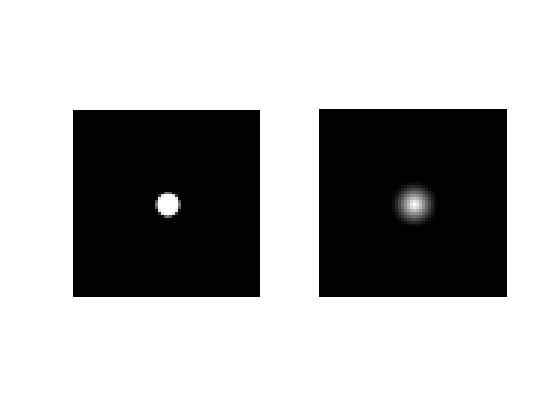
a = imread('single.tif');
out = auto(a);

subplot(1,2,1);
imshow(a);
subplot(1,2,2);
imshow(out);
close all;
x = 0:8;
N = 64/2+1;
y = out(N,x+N);
plot(x,y);
xi = linspace(0,8,100);
yi = gcyl(xi/8);
plot(x,y,'o',xi,yi);
xlabel('radius (pixels)');
ylabel('value');

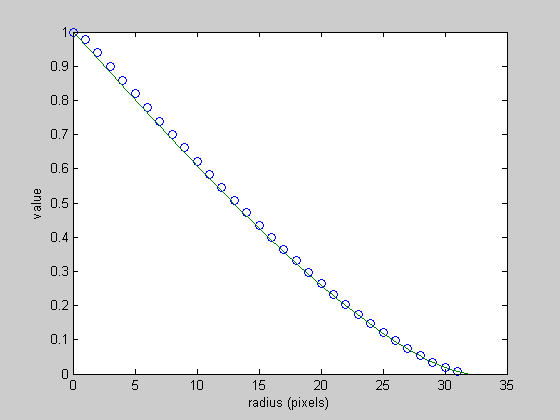
The marked data points are taken from a horizontal cross-section of the output image. The solid curve is the ideal function, which was generated from gcyl(r/8). The factor of 8 converts pixel distance to the appropriate normalized distance.
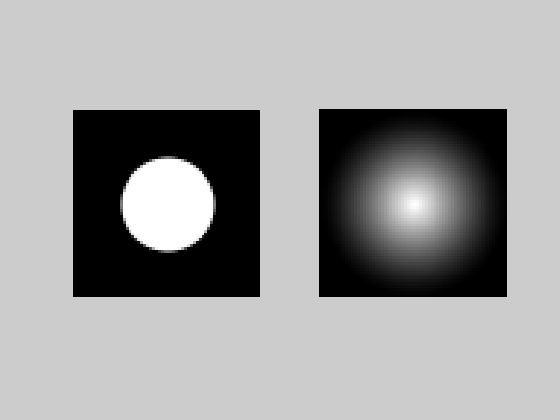
a = imread('circ.tif');
out = auto(a);

subplot(1,2,1);
imshow(a);
subplot(1,2,2);
imshow(out);
close all;
x = 0:31;
N = 64/2+1;
y = out(N,x+N);
plot(x,y);
xi = linspace(0,32,100);
yi = gcyl(xi/32);
plot(x,y,'o',xi,yi);
xlabel('radius (pixels)');
ylabel('value');
example 2
 | |  |
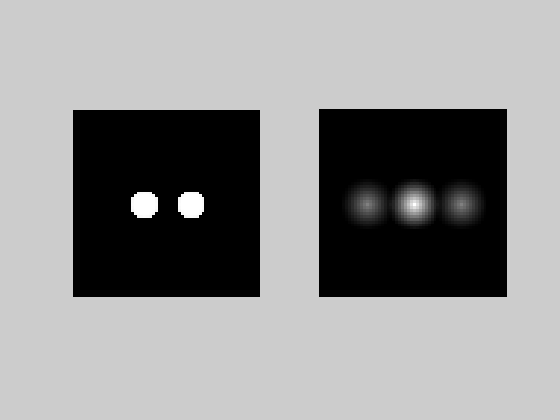
a = imread('double.tif');
out = auto(a);

subplot(1,2,1);
imshow(a);
subplot(1,2,2);
imshow(out);
close all;
% use theoretical rather than samples
%x = -24:24;
%y = out(33,33+x);
xi = linspace(-25,25,501);
yi = 0.5*gcyl((xi+16)/8)+gcyl(xi/8)+0.5*gcyl((xi-16)/8);
plot(xi,yi,'k');
xlabel('distance (pixels)');
ylabel('value');
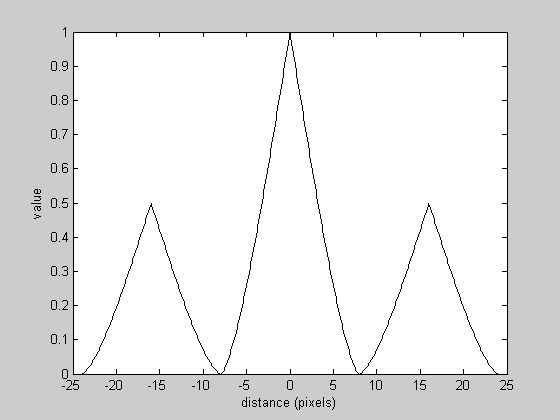
There are three peaks. The central peak is twice the height of its neighbors. The relative peak heights and locations are shown in the diagram (b) below.
|  |
| (a) | (b) |
example 3
If the input function is real and has inversion symmetry (f(-x,-y) = f(x,y)) then the autocorrelation function is the same as the self convolution function. This example shows an input function without inversion symmetry.
 |  | 
|
 |  | |
| image | auto | self |
a = imread('triple.tif');
out1 = auto(a);
out2 = self(a);

subplot(1,3,1);
imshow(a);
subplot(1,3,2);
imshow(out1);
subplot(1,3,3);
imshow(out2);
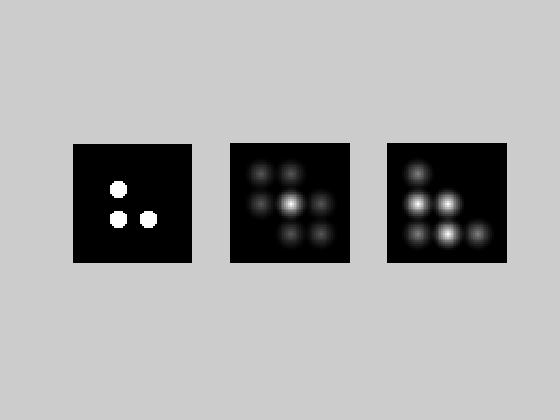
The patterns above are simple enough to be reasoned mentally. However, the MATLAB function peak.m can be used to search for peaks in an image. The results of applying this program to the autocorrelation image are:
peak(out1,0.05,8);
image size: 64 x 64
block size: 8
threshold: 0.05
max # peaks: 20

peak	   value	 row	 col
   1	1.000000	  33	  33
   2	0.333333	  17	  17
   3	0.333333	  33	  17
   4	0.333333	  17	  33
   5	0.333333	  49	  33
   6	0.333333	  33	  49
   7	0.333333	  49	  49