Convert to xyi indices:
Look along the body diagonal (I-direction). All possible colors are confined to the RGB cube.
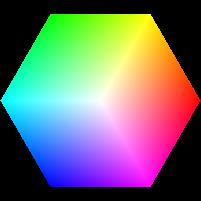
In the image above, you can see the internal edges of the cube. This is due to mach bands, and is difficult to remove. See blending.
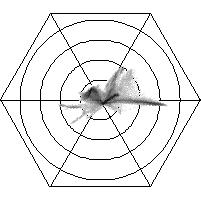
The diagram above is a reference framework for 2D histograms. The circles denote color brightness or saturation since they are perpendicular to the intensity axis.

The 2D histogram (scattergram) below corresponds to the image above. It was negated, making the background white and the probability dark. The magnitude was logarithmically scaled. Otherwise the background color dominates.
Maintained by John Loomis, last updated 10 June 1998