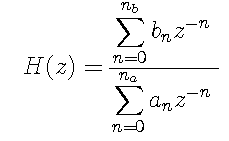
Filters whose transfer functions are rational polynomials in z can be written as


Much can be gained by investigating the properties of individual zeros and poles. Suppose we have a single term of the form


 we have the transfer function

 ,
so we can let
  be zero for the sake of this
discussion, that is


function  hf = H(nu,r)
% H
%
%   Calculates frequency response for single zero/pole
%
%       hf = H(nu,r)
%
%       nu = vector of normalized frequency values
%	r  = zero/pole position (scalar)
%
%       hf = vector of complex response values

 hf = 1 - r*cos(2*pi*nu) + i*r*sin(2*pi*nu);

function  ang = phase(nu,r)
% PHASE
%
%   Calculates phase shift for single zero/pole
%
%       ang = phase(nu,r)
%
%       nu = vector of normalized frequency values
%	r  = zero/pole position (scalar)
%
%       ang = vector of phase shifts (in radians)

if (abs(r)>1)
  ang = atan2(r*sin(2*pi*nu),1-r*cos(2*pi*nu));
else
  ang = atan(r*sin(2*pi*nu)./(1-r*cos(2*pi*nu)));
end
  ang = unwrap(ang);

function  gd = grd(nu,r)
% GRD
%
%   Calculates group delay for single zero/pole
%
%       gd = grd(nu,r)
%
%       nu = vector of normalized frequency values
%	r  = zero/pole position (scalar)
%
%       gd = vector of group delay values (in samples)

cs = cos(2*pi*nu);
gd = r*(r-cs)./(1-2*r*cs+r*r);


function ZERO(r)
%
%  ZERO
%
%    generates set of plots for single zero transfer function
%
%         r = scalar value of the zero

nu = linspace(-0.5,0.5,200);

disp(sprintf('zero position =  %g',r));
disp(sprintf('max magnitude = %g',1+abs(r)));
disp(sprintf('min magnitude = %g',1-abs(r)));

subplot(2,2,1);
plot(nu,abs(H(nu,r)),'k');
grid
xlabel 'Normalized frequency (Fs == 1)'
ylabel 'Magnitude response'
subplot(2,2,2);
plot(nu,phase(nu,r)/pi,'k');
grid
xlabel 'Normalized frequency (Fs == 1)'
ylabel 'phase shift (divided by \pi)'
subplot(2,2,3)
plot(nu,grd(nu,r),'k');
grid;
xlabel 'Normalized frequency (Fs == 1)'
ylabel 'Group delay (in samples)'
subplot(2,2,4)
u = [-0.5: 0.1: 0.5];
plot(H(nu,r),'k');
hold on;
plot(H(u,r),'ko');
grid
axis square
axis equal
xlabel 'Real'
ylabel 'Imag'
hold off;


function POLE(r)
%
%  POLE
%
%    generates set of plots for single pole transfer function
%
%         r = scalar value of the zero

nu = linspace(-0.5,0.5,200);

disp(sprintf('plot position =  %g',r));
disp(sprintf('max magnitude = %g',1/(1-abs(r))));
disp(sprintf('min magnitude = %g',1/(1+abs(r))));

subplot(2,2,1);
plot(nu,1.0./abs(H(nu,r)),'k');
grid
xlabel 'Normalized frequency (Fs == 1)'
ylabel 'Magnitude response'
subplot(2,2,2);
plot(nu,-phase(nu,r)/pi,'k');
grid
xlabel 'Normalized frequency (Fs == 1)'
ylabel 'phase shift (divided by \pi)'
subplot(2,2,3)
plot(nu,-grd(nu,r),'k');
grid;
xlabel 'Normalized frequency (Fs == 1)'
ylabel 'Group delay (in samples)'
subplot(2,2,4)
u = [-0.5: 0.1: 0.5];
p = linspace(-6,6,600);
plot(1.0./H(sign(p).*10.^(-abs(p))/2,r),'k');
hold on;
plot(1.0./H(u,r),'ko');
grid
axis square
axis equal
xlabel 'Real'
ylabel 'Imag'
hold off;
Maintained by John Loomis, last updated 17 Oct 1997