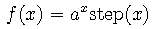
The continuous function is
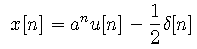
Because the function is discontinuous at the origin, it should be sampled as the discontinuity midpoint, that is f(0) = x[0] = 1/2.
function  y = func(x,a)
%
%  FUNC(X,A)
%
%  Continuous function y = a^x
%

   y = a.^x;
The sequence corresponding to the continuous function is generated by the following matlab code. We let a = 0.4 and use 16 samples from the sequence.
a=0.4;
N=16;
n = 0:N-1;
x = func(n,a);
x(1) = 0.5;  % account for discontinuity
The following plot shows the function (solid line) and sampled values (circles)
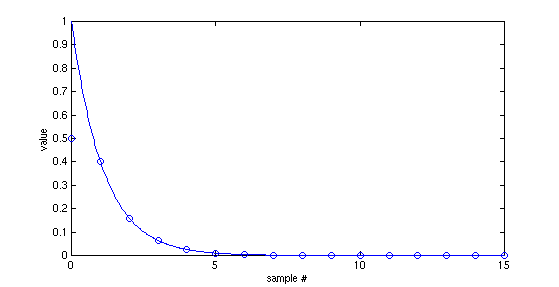
Matlab code to generate the plot is
u = linspace(0,N-1,500);
plot(u,func(u,a))
hold on
plot(n,x,'o');
hold off
xlabel('sample #');
ylabel('value');
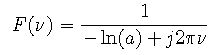
function  y = FC(nu,a)
%
%  FC(NU,A)
%
%  Fourier Transform of Continuous function y = a^x step(x)
%

   y = 1./(-log(a)+2*j*pi.*nu);

function  y = GD(nu,a)
%
%  GD(NU,A)
%
%  Fourier Transform of sequence a^n u[n] - 0.5 delta[n]
%

   y = 1./(1-a*exp(-j*2*pi.*nu)) - 0.5;
function  y = ALIAS(nu,M,a)
%
%  ALIAS(NU,M,A)
%
%  Aliased continuous spectrum  sum_{k=-M}^M F(nu-k)
%

   v = -M:M;
   for i=1:length(nu)
     y(i) = sum(fc(nu(i)-v,a));
   end
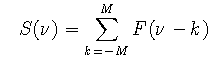
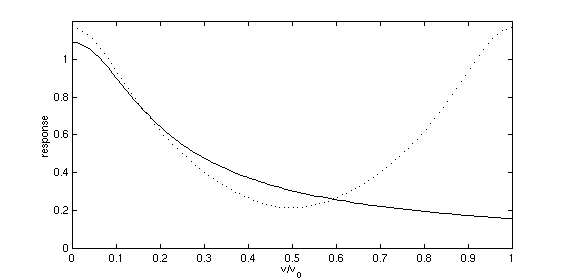
The following curves compare the Fourier Transform of the sampled function to that of the continuous function. The dotted curve in each case is the Fourier Transform of the sampled function. The solid curve is the Fourier Transform of the continuous function, possibly including alias overlap.
s = linspace(0,1,500);
plot(s,abs(fc(s,a)),'k');
hold on
plot(s,abs(gd(s,a)),'k:');
hold off
axis([0 1 0 1.2]);
xlabel('\nu/\nu_0')
ylabel('response')
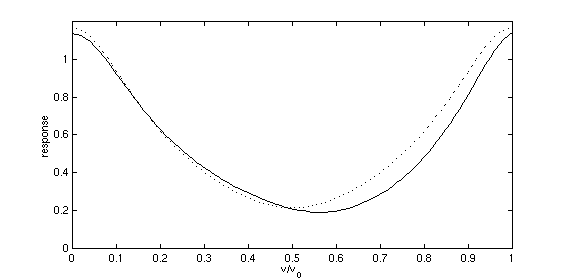
M=1;

plot(s,abs(alias(s,M,a))'k');
hold on
plot(s,abs(gd(s,a)),'k:');
hold off
axis([0 1 0 1.2]);
xlabel('\nu/\nu_0')
ylabel('response')
The Discrete Fourier Transform (DFT) is calculated by
y = fft(x);
The magnitude of the DFT is compared to the actual Fourier transform in the following plot. The solid curve is the actual function, the circles are generated by the DFT algorithm.
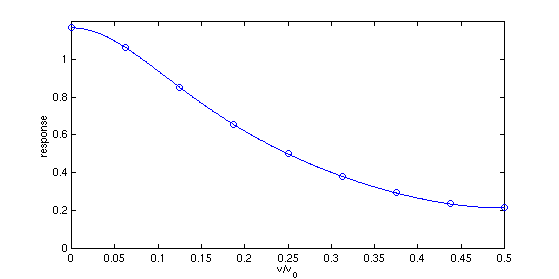
s = linspace(0,0.5,500);
k = 0:N/2;
plot(s,abs(gd(s,a)));
hold on
plot(k/N,abs(y(1:N/2+1)),'o');
hold off
axis([0 0.5 0 1.2]);
xlabel('\nu/\nu_0');
ylabel('response');
The phase of the DFT is compared to the actual Fourier transform in the following plot. The solid curve is the actual function, the circles are generated by the DFT algorithm.
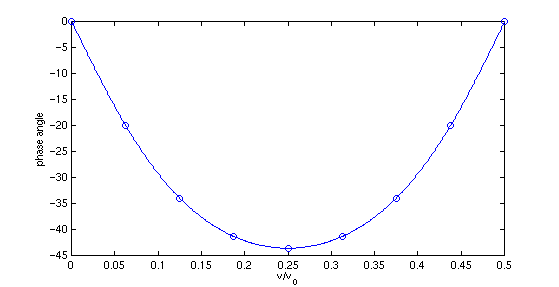
deg = 180/pi;
plot(s,angle(gd(s,a))*deg);
hold on
plot(k/N,angle(y(1:N/2+1))*deg,'o');
hold off
xlabel('\nu/\nu_0');
ylabel('phase angle');
The complex values of the DFT are plotted on the complex plane as is the actual Fourier Transform of the sequence. The solid curve is the actual function, the circles are generated by the DFT algorithm.
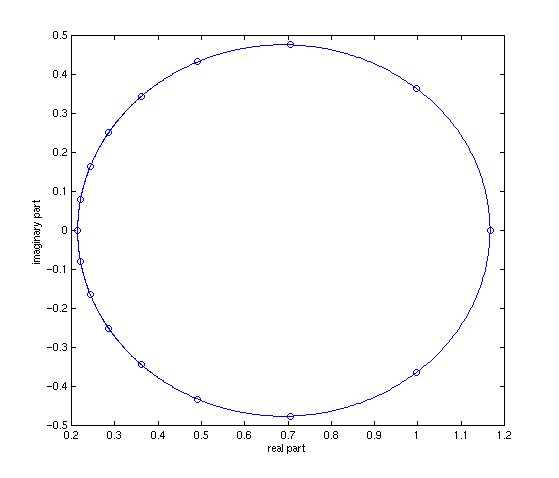
s = linspace(0,1,1000);
plot(gd(s,a));
axis([0.2 1.2 -0.5 0.5]);
hold on
plot(y,'o');
xlabel('real part');
ylabel('imaginary part');
Maintained by John Loomis, last updated 17 Sept 1997