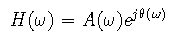
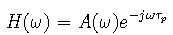
The frequency response of a digital filter can be expressed as a complex phasor
 is called the phase delay
of the filter and is measured in samples (a dimensionless number).
is called the phase delay
of the filter and is measured in samples (a dimensionless number).
If the phase delay is an integer, there is a delay
of samples. If it is fractional, there is an interpolated
delay of samples. In either case, if the phase delay is
constant the output signal will be a distortion-free copy of the the input signal, so long as
the input signal is in the pass band of the filter.
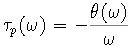
The concept of phase delay is defined also for filters that do not necessarily have linear phase. The general definition of phase delay is given by
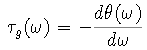
Another convenient measure of the linearity of the phase is the group delay. The basic concept relates to the effect of the phase on a narrowband signal. Suppose, for example, that we have an input signal of the form

 is nonzero only around
 , the effect of the phase of the system can be approximated
near that value as the linear approximation
, the effect of the phase of the system can be approximated
near that value as the linear approximation

The group delay of a filter is then defined by
Matlab has a function
grpdelay that calculates the group delay.
Consider the textbook example 5.9 of a system function with both poles and zeros.
z = [-1  exp(1.0376j) exp(-1.0376j)]';
p = [0.683 0.892*exp(0.6257j) 0.892*exp(-0.6257j)]';
k = 0.05634;
The pole-zero plot for this example is given by
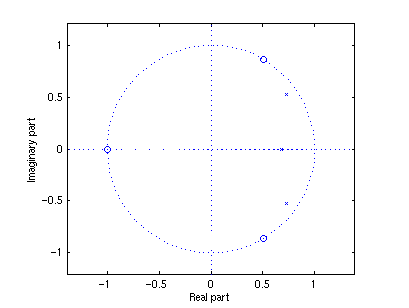
zplane(z,p)using the Matlab function
zplane.
The transfer function is generated by
[b a] = zp2tf(z,p,k)

b =

    0.0563   -0.0009   -0.0009    0.0563


a =

    1.0000   -2.1290    1.7833   -0.5434
using the Matlab function
zp2tf.
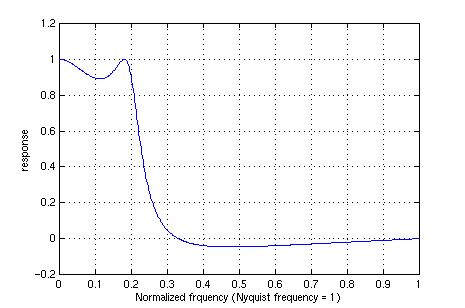
and the transfer function is used to generate the following plot of the frequency response:
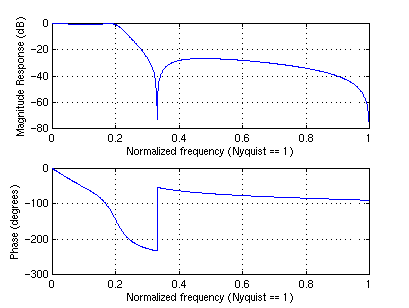
freqz(b,a)The Matlab function
freqz can also be used to generate numerical values for the frequency response:
[h, w] = freqz(b,a);which can be used to produce other plots of the response curve, such as the magnitude response:
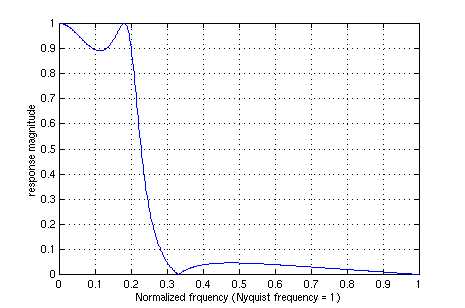
plot(w/pi,abs(h))
grid
xlabel('Normalized frquency (Nyquist frequency = 1)')
ylabel('response magnitude');
The group delay plot shown below
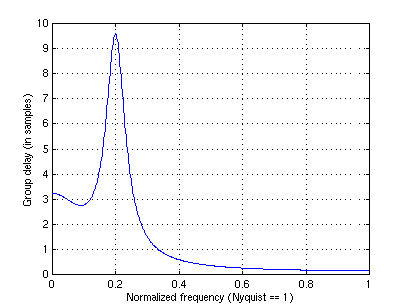
grpdelay(b,a)Numerical values for the group delay were generated by
[gd, w] = grpdelay(b,a);
A polar plot of the complex frequency response shows the interaction between magnitude and phase
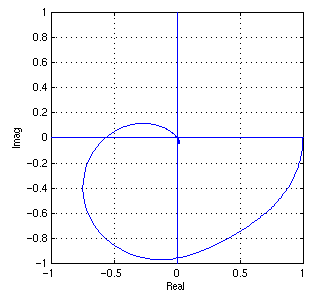
plot(h)
axis equal
axis square
axis([-1 1 -1 1]);
grid
line([0 0],[-1 1]);
line([-1 1],[0 0]);
xlabel Real
ylabel Imag
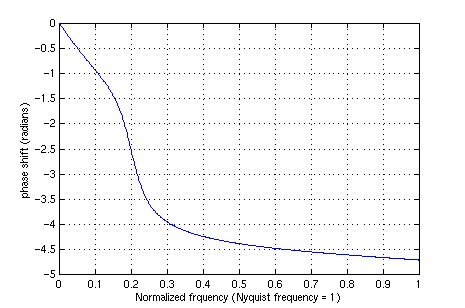
The phase of the frequency response was generated by
ang = angle(h)
ang = unwrap(ang);
However, there is still a phase discontinuity representing phase reversal. This was located by inspection and corrected as follows:
mag = abs(h);
mag(171:512) = -mag(171:512);
ang(171:512) = ang(171:512)-pi;
Both the magnitude and the phase are now continuous functions, as shown in the plots below:
plot(w/pi,mag)
grid
xlabel('Normalized frquency (Nyquist frequency = 1)')
ylabel response
plot(w/pi,ang);
grid
xlabel('Normalized frquency (Nyquist frequency = 1)')
ylabel 'phase shift (radians)'
The phase delay function was calculated as follows. There is a indeterminate point at the origin that generates a NaN. This was corrected by the expediency of setting the first point equal to the second (l'Hopital's rule).
pd = -a./w;

Warning: Divide by zero.
pd(1)=pd(2);
Finally the group delay (in black) and phase delay (in blue) were plotted on the same graph:
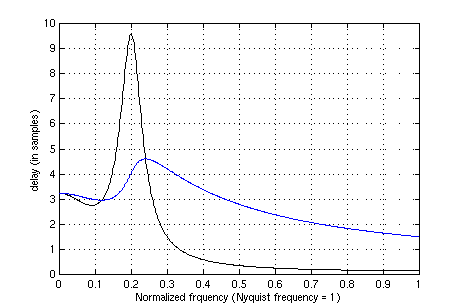
plot(w/pi,gd,'k',w/pi,pd,'b')
grid
xlabel('Normalized frquency (Nyquist frequency = 1)')
ylabel 'delay (in samples)'
Maintained by John Loomis, last updated 15 Oct 1997