ECE 323L Basic Electronic Circuits Laboratory
Lab 7
|
Names: |
|
Do the following exercises. Report your results by editing this Word document and submitting it in WebCT.
In each of these exercises you will need to record the following measurements from the oscilloscope.
- Frequency
- Peak-to-peak voltage of the input waveform
- Peak-to-peak voltage of the output waveform
- Phase difference between input and output
These measurements can all be made using the electronic tools in the oscilloscope.
The image below shows a sample measurement. The input waveform is on the top and
The output waveform is on the bottom.
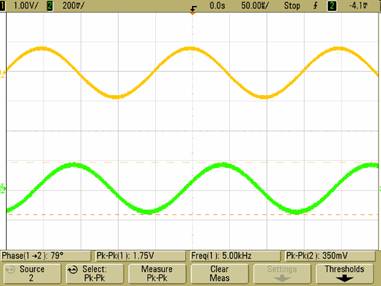
From your observations, you should be able to tell whether this is a RC circuit or an RL circuit. Enter your choice here:
_____ RC Circuit
_____ RL Circuit
Be sure you record the nominal values of R, L, and C for all the circuits you work with.
- Use resistor and capacitance substitution boxes to generate an RC circuit.
Choose a value of capacitance in the middle range, 0.3-0.6 mF and a resistance about 200-600 ohm. Measure the AC response (as described above) for a number of frequencies from 100 Hz to 10 kHz. Determine whether the response is greater at low frequencies or high frequencies. Does the response lead or lag the input?
- Replace the capacitor box with an inductor box to form an RL circuit as shown below.
Choose a mid-range inductance (3-5 mH) and the same resistance as before. Measure the AC response (as described above) for a number of frequencies from 100 Hz to 10 kHz. Determine whether the response is greater at low frequencies or high frequencies and whether the response phase leads or lags the input.
- Use inductor, capacitor, and resistor substitution boxes arranged as:
Choose the same inductor, capacitor, and resistor values as the previous two exercises. Start by tuning the frequency for maximum response and measure the AC response at that frequency. Then tune the frequency lower until the response drops to half the value of the maximum, and record the AC response. Finally tune the frequency higher until the response again drops to half the value of the maximum. The difference in frequency between these two points is the bandwidth.
Capture example oscilloscope images for each circuit and include them in your report
maintained by John Loomis, updated 18 February 2008