
The following circuit was constructed, with Rf = 470 kΩ, Rs = 47 kΩ, and RC = 10 kΩ.
Gain and phase shift were measured as a function of frequency, and the following results were obtained:
| Frequency | Gain | Phase |
|---|---|---|
| 1 Hz | 10 | 180° |
| 100 Hz | 10 | 180° |
| 1 kHz | 10 | 180° |
| 10 kHz | 10 | 180° |
| 20 kHz | 9.8 | -153° |
| 60 kHz | 5 | -109° |
| 100 kHz | 3 | -90° |
The input signal generator was set to 2.5 V peak-to-peak at 10 Hz. Th Signal should be 25 V peak-to-peak, but the supply is 24 V peak-to-peak. The actual range is 21.7 V peak-to-peak as shown in the oscilloscope trace below;
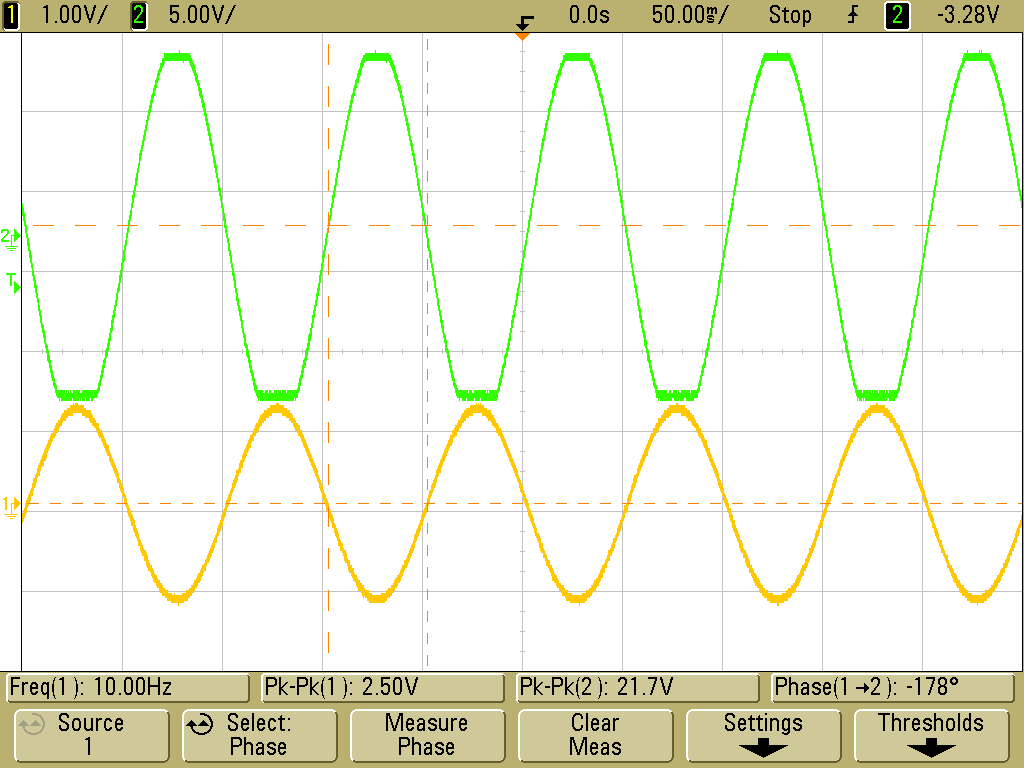
Figure 3. Oscilloscope trace showing saturation
The op-amp can produce only a finite rate of change at its output. This limit rate is called the slew rate. The oscilloscope trace below shows the effect of slew rate limitations on a 10-kHz square wave.
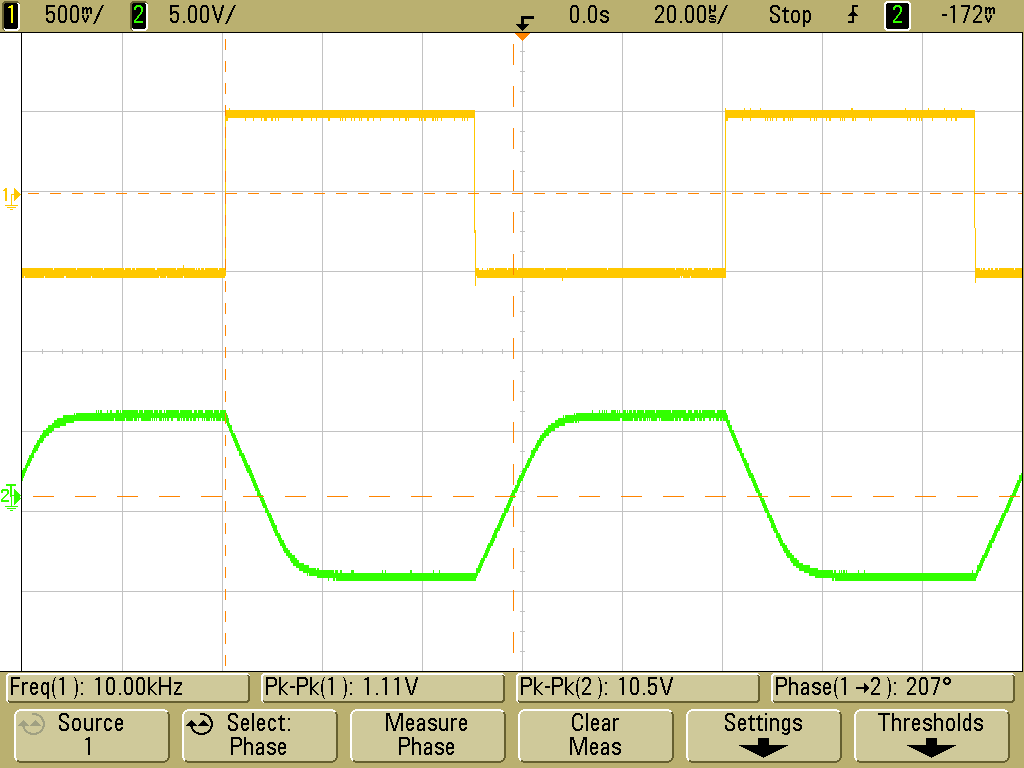
Figure 4. Slew rate measurements at 10 kHz.
The observed Rise/Fall time (10-90%): 12 ms.
Voltage change: 10.5 V peak-to-peak
The slew rate is then (0.8)(10.5 V)/(12 ms) = 0.7 V/μs.
The slew rate limitation can affect sinusoidal signals as well as square waves. The output becomes visibly distorted and at higher frequencies resembles a triangular wave, as shown below.
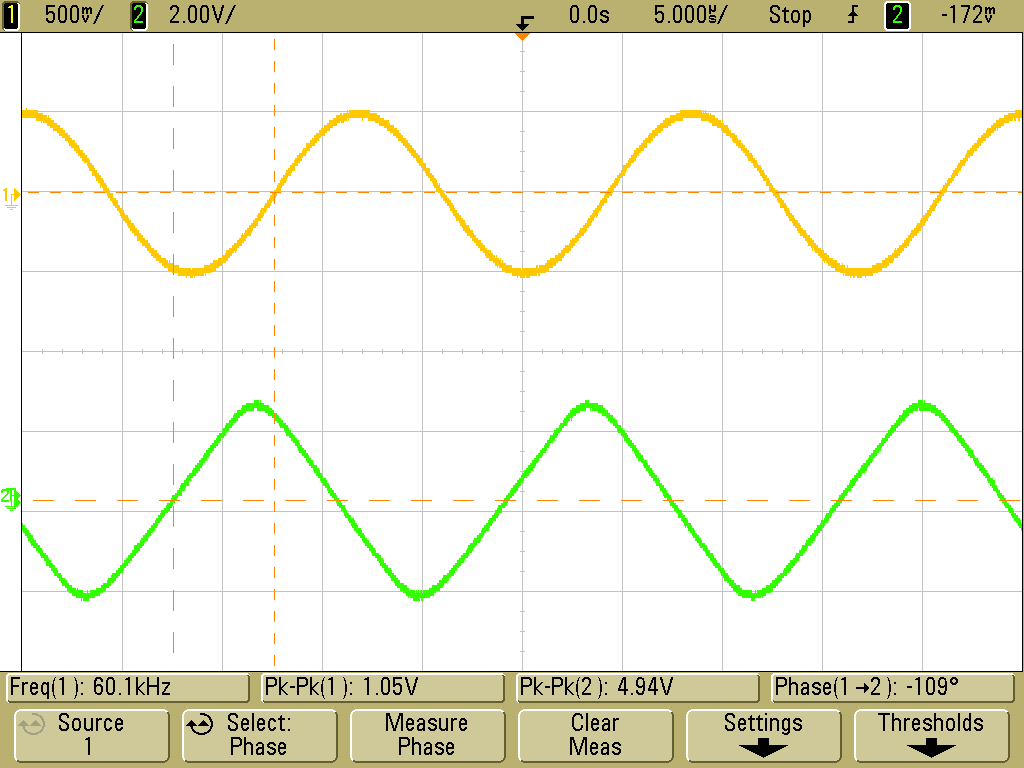
Figure 5. Distortion of sinuosoidal signal due to slew rate limitations.
Maintained by John Loomis, last updated 23 March 2009