ECE 201L Circuit Analysis Laboratory
Lab 9
This lab explores the properties
of bipolar junction transistors (BJTs)
Do the following exercises. Report your results by creating a
Word document, submitting it in Isidore, and turning in
a printed copy. Submit one report per group.
- Identify the 2N3904 (npn) and 2N3906 (pnp) transistors. Measure the
β of the transistors using the hFE setting on the handheld
multimeters. Obtain measurements for the transistors connected
correctly and backwards (interchange C and E).
Use a 2N3904 (npn) transistor in the following circuits.
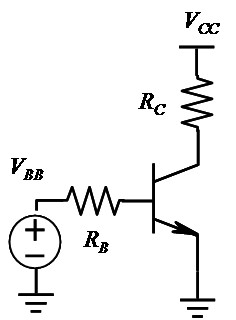
- Build the following circuit. Select RB
between 1.5 – 2.5 kΩ and RC between
100 – 300 Ω. Connect VCC to a 9-volt power source
from the dual-output supply.
Use the other power output to provide 0 – 6 V for
VBB and connect the multimeter to measure the voltage across
RC. Calculate the current through RC using Ohm's Law.
Plot the current IC against VBB. Take readings approximately
0.2 V apart. Identify the control voltages
(and corresponding currents) for the cutoff region, linear region,
and saturation region of operation.
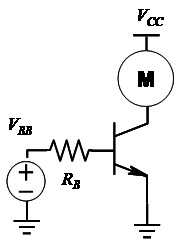
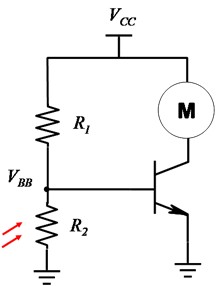
- Build the following circuit, replacing resistor
RC from above with the motor. Measure the
voltage across the motor as a function of the input control voltage.
Identify the minimum control voltage needed to fully turn on the
motor.
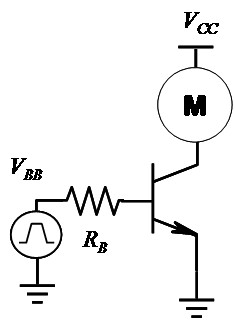
- Replace the control signal from the power supply
with a signal from the signal generator. Set the signal generator to
produce a 1 kHz square wave with a minimum voltage of zero and a
maximum voltage approximately twice the control voltage determined in the above
measurement. Vary the duty cycle and observe that you can change the
speed of the motor. This is called pulse-width modulation
(PWM). Determine the duty cycle that allows the motor to just barely
spins. Note that if the motor stops you may need to jack up the duty
cycle to get it spinning again before trying to slow the motor down.
Capture an oscilloscope image showing the control signal for having
the motor turning near minimum speed.
- Build the “night light” circuit shown below
transistor. Make the resistance R1 about 30
kΩ. You can use a 10k potentiometer and a 25k fixed resistance
to allow some “tuning”.
Make VCC
= 9 Volts. Demonstrate your circuit to the teaching assistant.
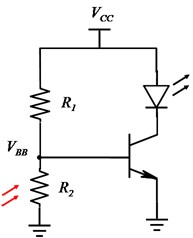
Measure the resistance of R1 and the voltage
VBB at which the
transistor begins to turn on (LED begins to glow).
- Replace the LED with an electric motor and demonstrate that
you can control the speed of the motor by the amount of light falling
on the photo cell.
Maintained by John Loomis,
last updated 16 July 2014