Construct the following circuit, shown in Figure 1, using a 100-300 Ω load resistor and a diode. You will need an accurate measurement of the load resistor so use the bench multimeter to make the measurement. Vs is the signal generator. Set the source frequency to 1 kHz and the amplitude to 5 Volts maximum (10 volts peak-to-peak).
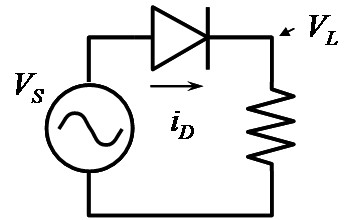
Figure 1. Diode test circuit
Do the following for each diode:
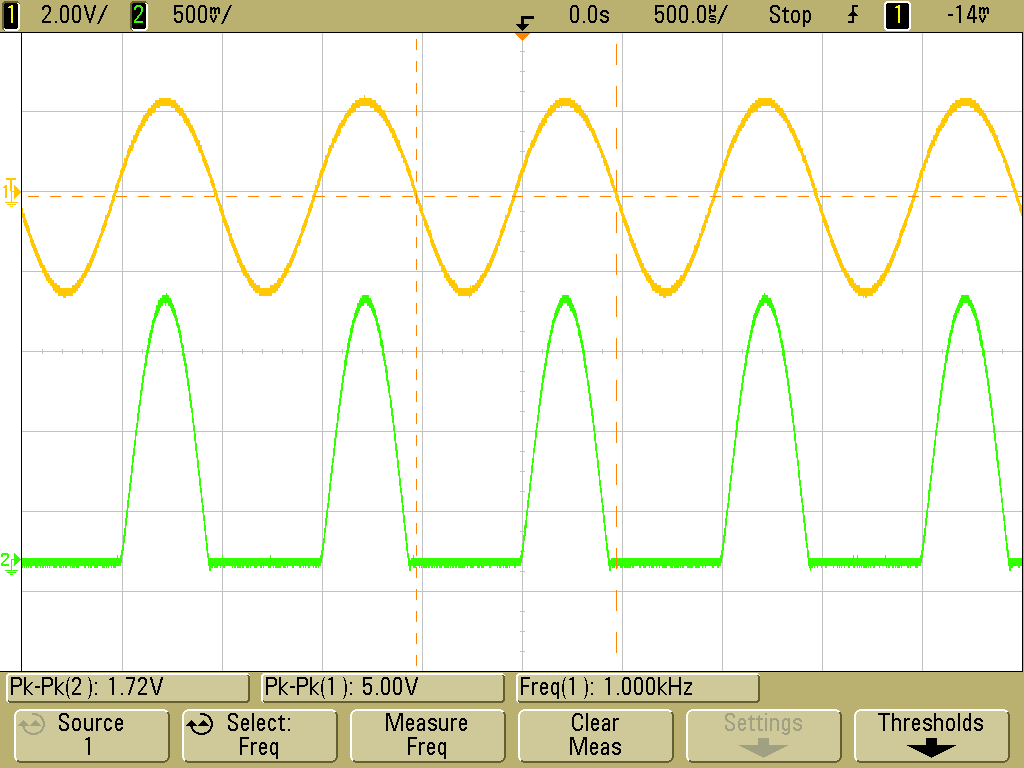
- Examine and capture the resulting input
and output signals on the oscilloscope. See example below:
- Change the oscilloscope display to XY mode (see instructions at the end of this document) and measure the turn-on voltage of each
diode. Capture the resulting oscilloscope images. See example below:
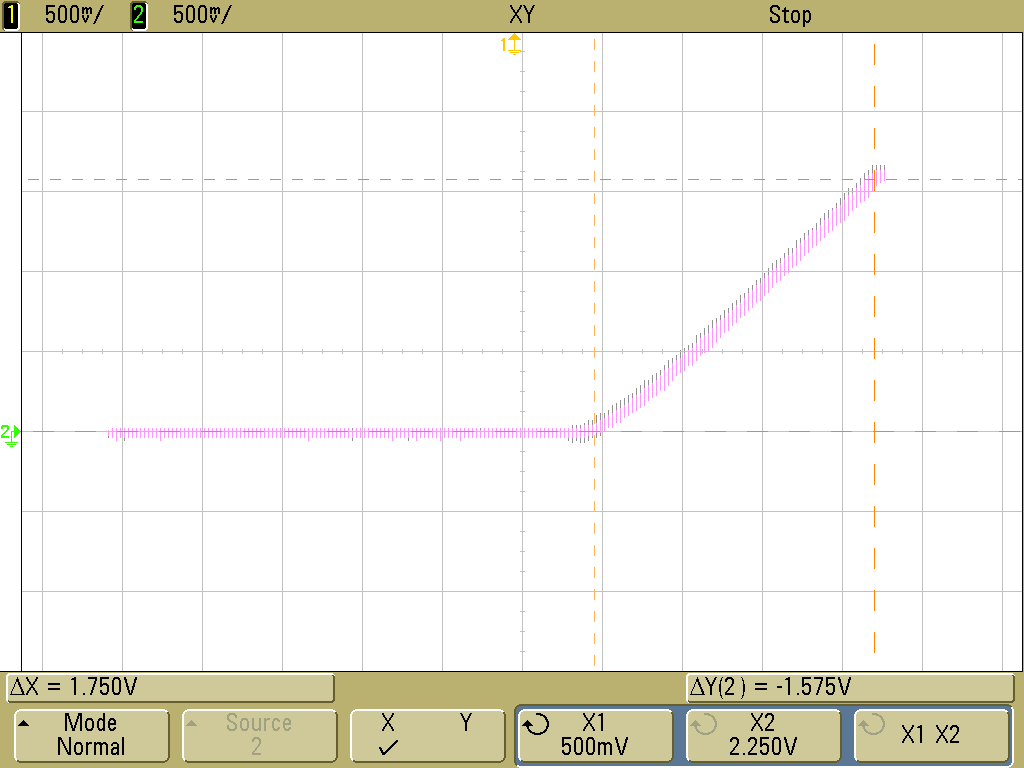
The XY plot above can be obtained more precisely from a set of DC measurements, as you should do next.
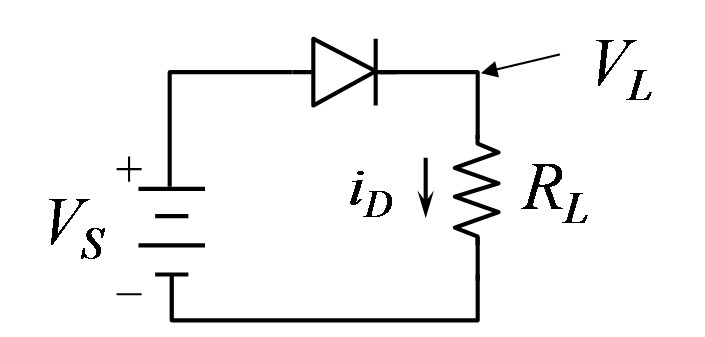
Figure 2. Diode test circuit (DC input).
An example of measured data are shown in Figure 3.
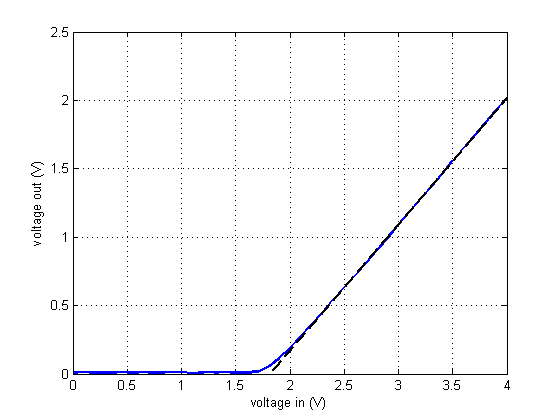
Figure 3. Example experimental data
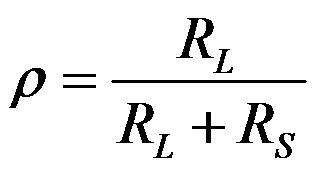
Calculate the turn on voltage Von from the x-intercept and the effective diode series resistance RS from the slope ρ of the linear part of the VL vs Vin curve,where
In the example above, the linear part of the curve includes input voltages 2 V and above.
Plot the diode characteristic curve by plotting the diode current ID = VL / RL versus the diode voltage VD = VS − VL, as shown by the example below.
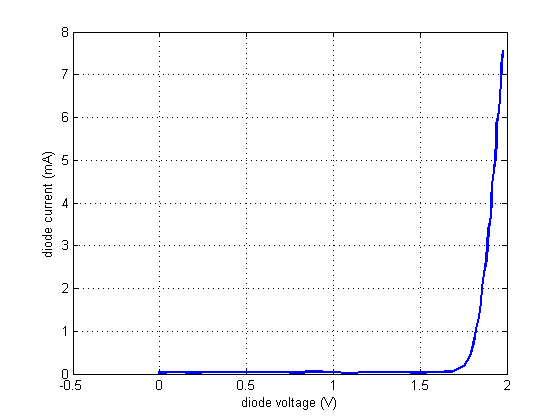
Figure 4. Example diode characteristic curve, ID vs. VD
Figure 5. Full-wave diode-bridge rectifier.
- Do the following for each bridge. Measure source voltage on oscilloscope with probes between A and B. Measure load voltage with probes between C and D. Do not attempt to measure both signals on the oscilloscope at the same time, the oscilloscope channels share a common ground and trying to make simultaneous measurements will introduce ground loop problems. Set the frequency of the source to 50 Hz and the amplitude to 10 volts peak-to-peak. Attach oscilloscope images of the source voltage and the load voltage to the report, showing the maximum voltage in each signal.
- For the LED bridge: Reduce the input frequency to 1 Hz. Observe the pattern of lights and describe in your report.
 ) knobs. Use the channel 1 and 2
volts/div knobs and the channel 1 and 2 Vernier softkeys to expand the
signal for convenient viewing.
) knobs. Use the channel 1 and 2
volts/div knobs and the channel 1 and 2 Vernier softkeys to expand the
signal for convenient viewing.