TracerDAQ contains several applications to acquire or generate data from your data acquistion system:
- Strip Chart with data logging functionality
- Oscilloscope
- Function Generator
- Rate Generator
|
TracerDAQ contains several applications to acquire or generate data from your data acquistion system:
|
Use the Strip Chart to acquire and log data from up to eight analog input, temperature input, digital input, or event counter channels
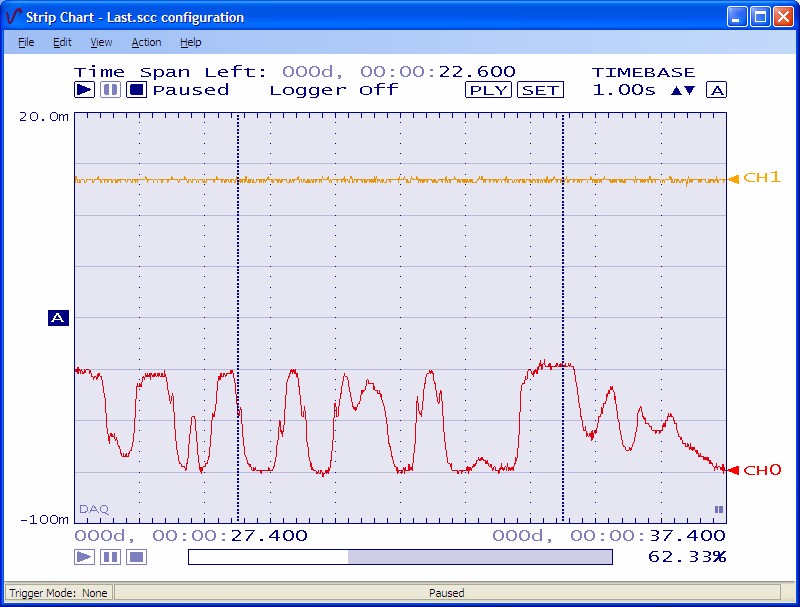
To run the Strip Chart, highlight it on the application list, and then click the Run button.
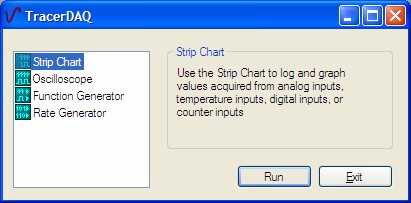
The Strip Chart window opens, as shown below.
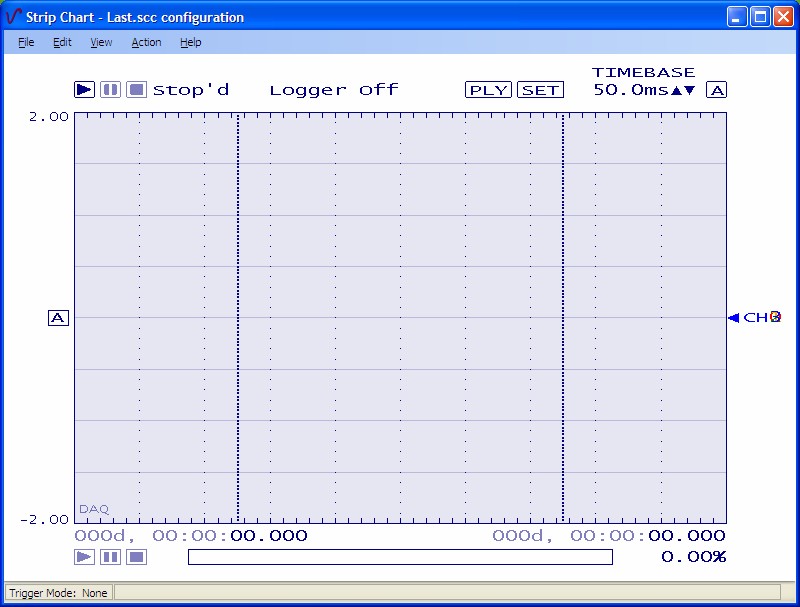
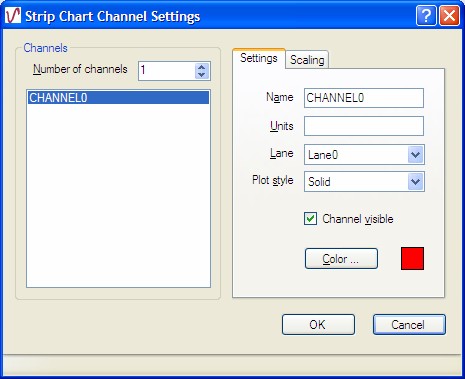
Once the Strip Chart window is open, you need to select the hardware, channel(s), and data range used as the data source.
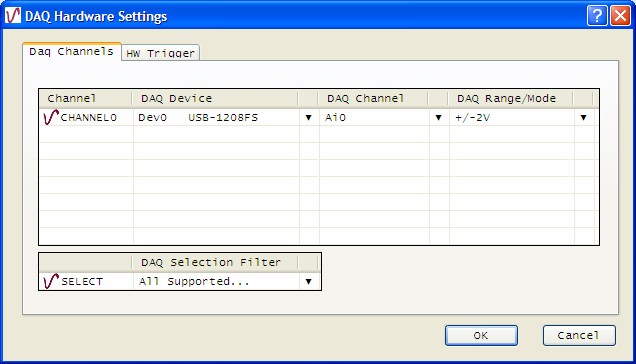
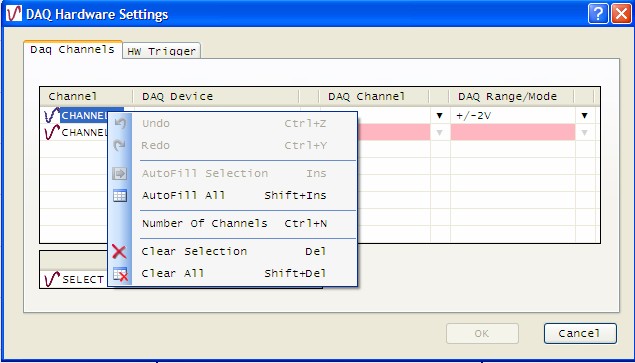
The drop-down list shows the device ID and device name for all boards that are configured by InstaCal. When you select a device, the first channel and range supported by the device appear in the DAQ Channel and DAQ Range/Mode columns.
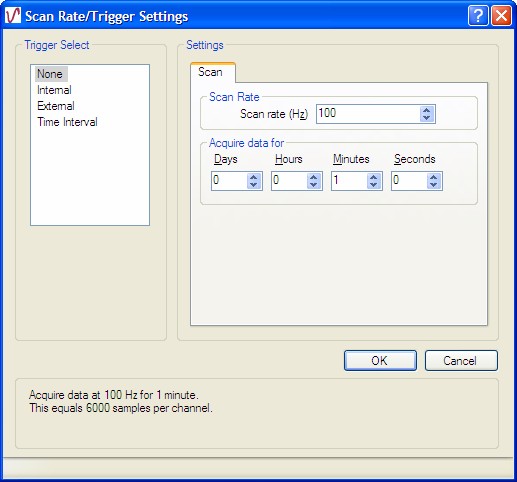
You can change the Scan Rate and Acquire data for settings
so that the scan runs for the desired time and at the desired rate. Then
click on the OK button to save the settings and close the dialog.
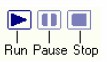 | The DAQ controls consist of the conventional Run, Pause, and Stop buttons to control data acquisition |
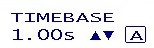
| Sets the value per major horizontal division. Click the up/down arrows to change the value. Use the mouse wheel to roll the timebase up or down. Hold the shift key to change the timebase by factors of ten. The Auto mode adjusts the timebase to continually display all data points. |
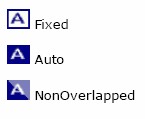
| Clicking on the Scale Mode hotspot sequences through three
scaling modes.
|
There are two ways to save data that you acquire on the strip chart:
The strip chart history file (*.sch) is a binary file. The Excel text file, comma-separated-value (*.csv), can be imported into Excel. Below is an exerpt from a .csv file.
Header Size:  8
Version:  2
Sampling Interval:  0.01
Sampling Rate:  100
Sample Count:  3000
Device Serial Number:  0
Culture Info:  en-US
Sample Number,Data/Time,CHANNEL0,CHANNEL1,CHANNEL2,CHANNEL3,Events
1,08/30/2012 02:54:35.406 PM, 2.5556, 0.0012, 0.0012, 0.0012, DAQ Start
2,08/30/2012 02:54:35.416 PM, 2.5604, 0.0012, 0.0037, 0.0037
3,08/30/2012 02:54:35.426 PM, 2.5556, 0.0012, 0.0037, 0.0037
4,08/30/2012 02:54:35.436 PM, 2.5482, 0.0012, 0.0037, 0.0037
5,08/30/2012 02:54:35.446 PM, 2.5458, 0.0012, 0.0012, 0.0037
6,08/30/2012 02:54:35.456 PM, 2.5556, 0.0012, 0.0037, 0.0037
7,08/30/2012 02:54:35.466 PM, 2.5604, 0.0012, 0.0012, 0.0037
8,08/30/2012 02:54:35.476 PM, 2.5580, 0.0012, 0.0012, 0.0012
9,08/30/2012 02:54:35.486 PM, 2.5482, 0.0012, 0.0037, 0.0012
Maintained by John Loomis, last updated 30 August 2012