ECE 201L Circuit Analysis Laboratory
Lab1
This lab provides experience with
- prototype construction with solderless breadboard
- components: LEDs, lamps, and DC motors.
- current measurements
- i-v characteristics and Ohm's Law
- Kirchoff's current law (KCL) and voltage law (KVL)
Attachment: lab1.doc.
See some demonstration pictures for typical lab setups.
Do the following exercises. Report your results by editing
the attached Word document, turning in a printed document and submitting it in Isidore.
Submit one report per group. Remember that responsiblity for reporting will rotate
among group members.
- Connect
a 1000-2000 ohm resistor to the HP 3630A power supply and HP 34401
multimeter as follows:
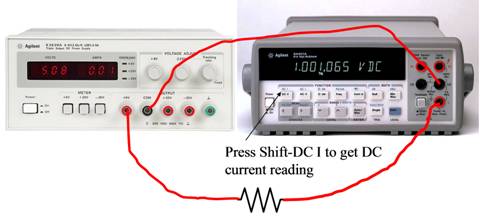
Record the voltage and current for at least five evenly-spaced,
input voltage levels from 1 to 6 volts. The voltages do not have to be
exact round numbers. Record the values on a spreadsheet and plot
current vs. voltage. Ohm’s law says that the data should lie on a
straight line whose slope is the conductance (1/R). Find the
resistance from your data and compare the value to that obtained by
direct measurement with a multimeter.
Paste a copy of your Excel plot in your lab report.
A plot of the difference between the fitted line and the data points is
often informative and you should include that plot as well.
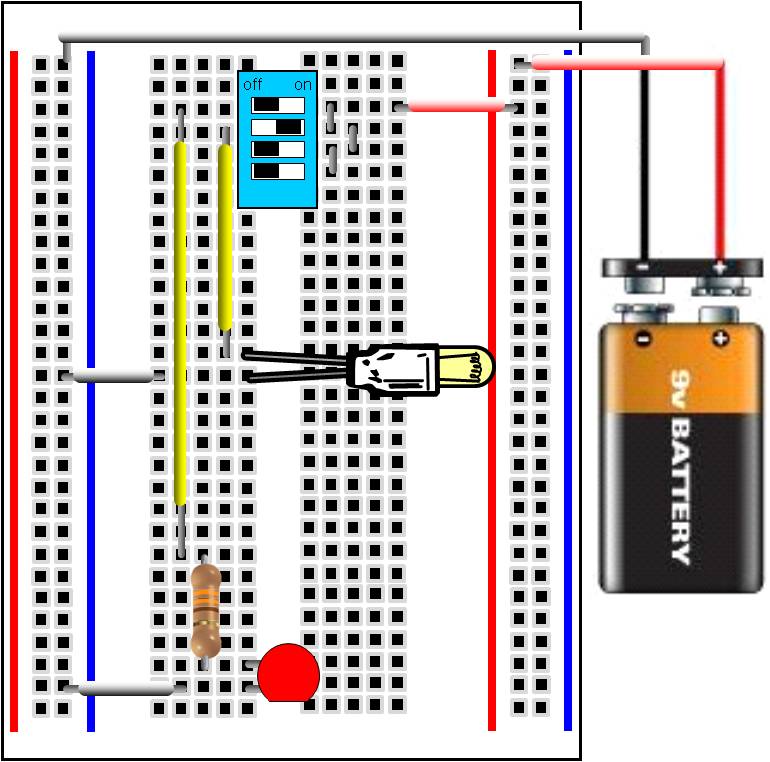
- Build a circuit consisting of a switch, 200-600 ohm resistor, and
red LED. Use proper breadboarding technique: connect the power
supply/multimeter combination to the power rails,
connect flat (short lead) of LED to negative side. Set the bench
power supply to provide 6 V.
Demonstrate to one of the instructors before turning on the power supply.
The red LED must be connected with
the longer lead toward the positive side of the battery. There is also a flat
area on the rim of the LED marking the negative end of the LED. The diagram below
illustrates a possible arrangement for controlling two separate lights.
- Measure the voltage across the power supply and
the voltage drop across the resistor and the red LED. Verify whether
Kirchoff’s Voltage Law (KVL) is satisfied for this circuit. Measure the
current through the circuit. Measure
the resistance (with power off) and calculate the current through the circuit.
- Build (modify) circuit consisting of LED, micro-lamp and bi-pin
lamp controlled by three switches. Demonstrate to one of the
instructors before applying power.
- Measure the current through the circuit for
the eight possible combinations of the three switches. Verify whether
the total current if more than one switch is closed equals the sum of
currents measured when only one switch is closed. (KCL)
- Connect the motor in place of the resistor in the above figure.
Vary the voltage from 1 to 6 volts, measure the current for the
unloaded motor and the stalled motor. To stall the motor, grab the
shift tightly with your fingers so that it can not rotate. Do not
stall the motor for longer than needed to measure the current. Fasten
a small piece of paper on the motor to observe the speed of the motor
as a function of the voltage.
Maintained by John Loomis,
last updated 29 August 2012