script1
clear all
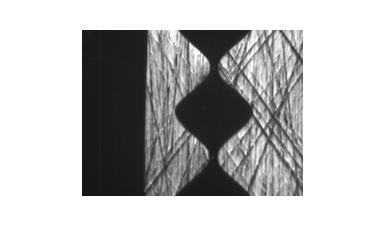
filename = 'easycell_001.png';
img = imread(filename);
g = rgb2gray(im2double(img));
clear img;
imshow(g);
sz = size(g);
imhist(g);
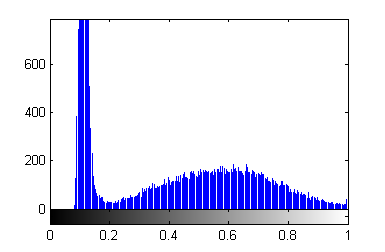
thres = 0.15;
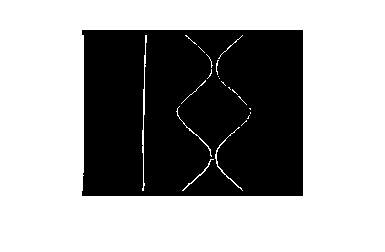
gt = g<thres;
imshow(gt);

g1 = sum(double(gt));
g1max = max(g1);
g1 = g1/g1max;
plot(g1);
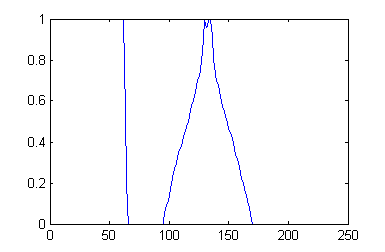
mid = 132;
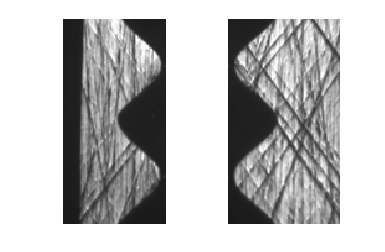
gleft = g(:,50:mid);
gright = g(:,mid:sz(2));
subplot(1,2,1);
imshow(gleft);
subplot(1,2,2);
imshow(gright);
clear gleft gright
close all
h = filters2(5);
h0 = h(:,:,1);
h1 = h(:,:,2);
h2 = h(:,:,3);
h11 = h(:,:,4);
h22 = h(:,:,5);
h12 = h(:,:,6);
a0 = imfilter(g,h0);
a1 = imfilter(g,h1);
a2 = imfilter(g,h2);
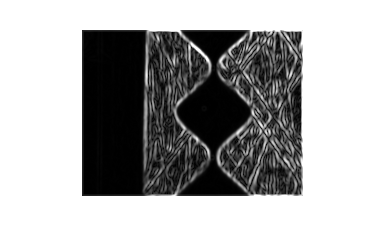
edgemag = sqrt(a1.^2 + a2.^2);
gmax1 = max(max(edgemag));
fprintf('maximum edgemag %g\n',gmax1);
edgemag = edgemag/gmax1;
et = 1.5;
imshow(et*edgemag);
maximum edgemag 10.7668
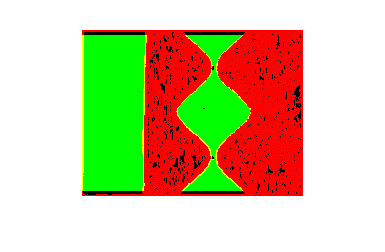
ge = edgemag>0.05;
gt(1:5,:) = 0;
gt(sz(1)-(1:5)+1,:)=0;
rgb = cat(3,ge,gt,zeros(size(ge)));
imshow(rgb);
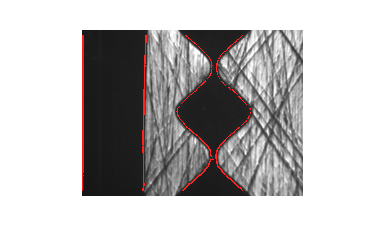
mask = and(gt,ge);
gc = cat(3,g.*~mask+mask,g,g);
imshow(gc);
imshow(mask);