measure bow-tie coordinates
Contents
clear
close all
load filelist
warning('off','images:initSize:adjustingMag');
m = 6;
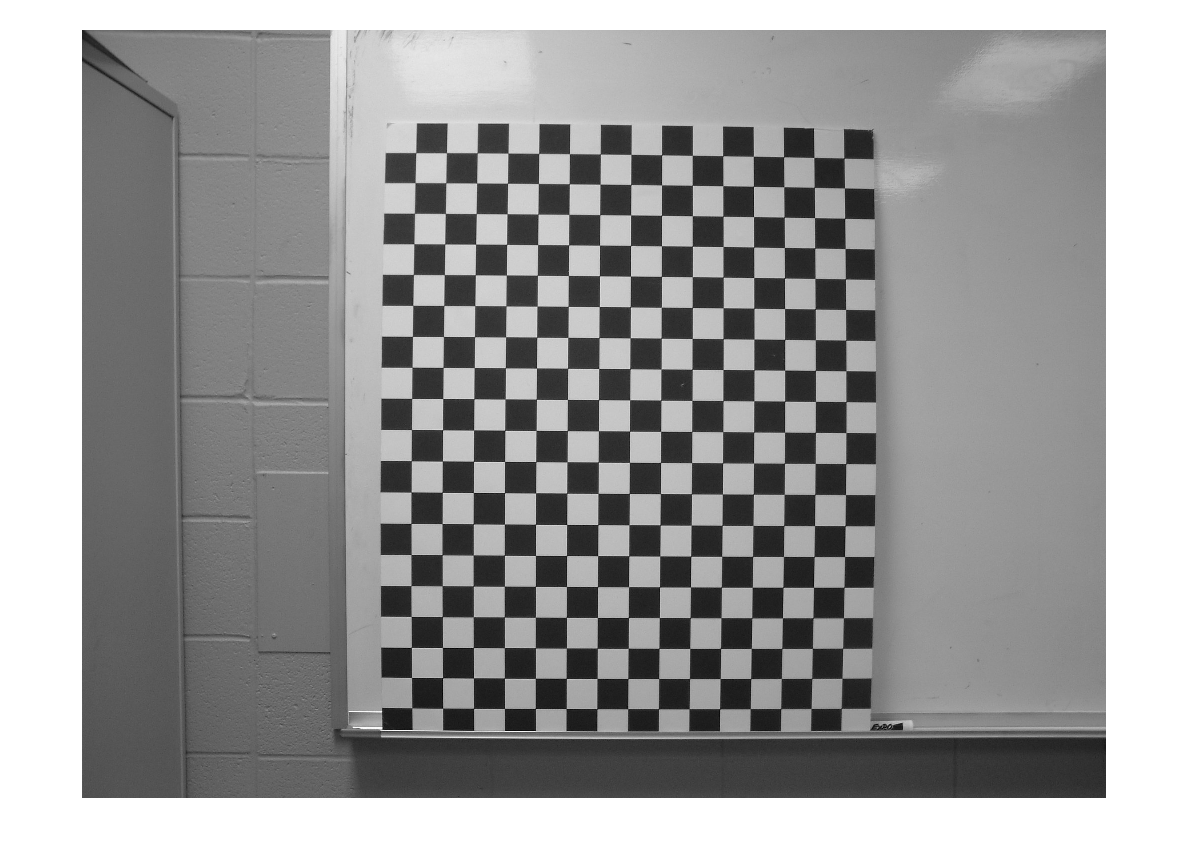
fname = files(m,:);
rgb = imread(fname);
im = rgb2gray(im2double(rgb));
imshow(im);
clear rgb;
h = filters2();
h0 = h(:,:,1);
h1 = h(:,:,2);
h2 = h(:,:,3);
h11 = h(:,:,4);
h22 = h(:,:,5);
h12 = h(:,:,6);
edges
a1 = imfilter(im,h1);
a2 = imfilter(im,h2);
bs = imfilter(im,h12);
bsmax = max(max(max(bs)),-min(min(bs)));
show vertices
c1 = a1/sum(sum(h1.^2));
c2 = a2/sum(sum(h2.^2));
c3 = bs/sum(sum(h12.^2));

xcen = -c2./c3;
ycen = -c1./c3;
rsq = xcen.^2+ycen.^2;
r = rsq<5;
g = zeros(size(im));
b = abs(bs)>0.2*bsmax;
imshow(cat(3,r,g,b));
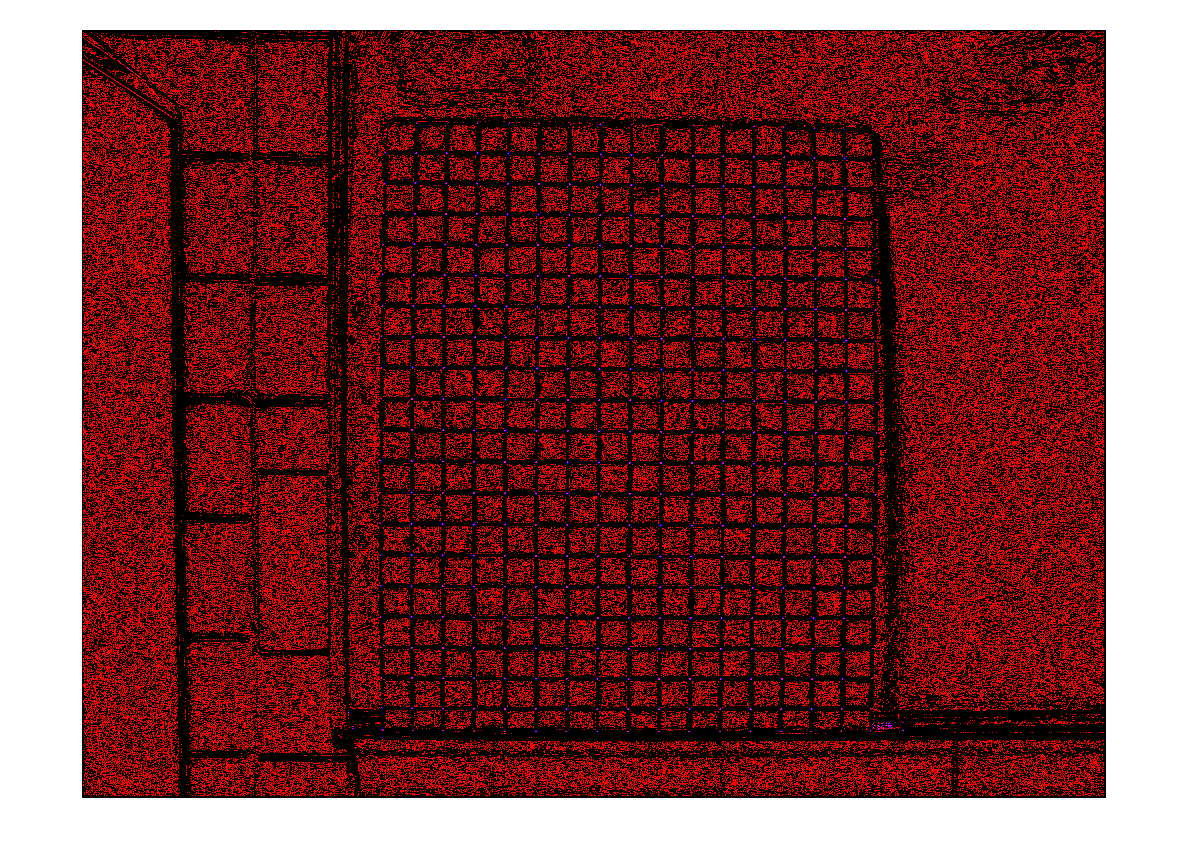
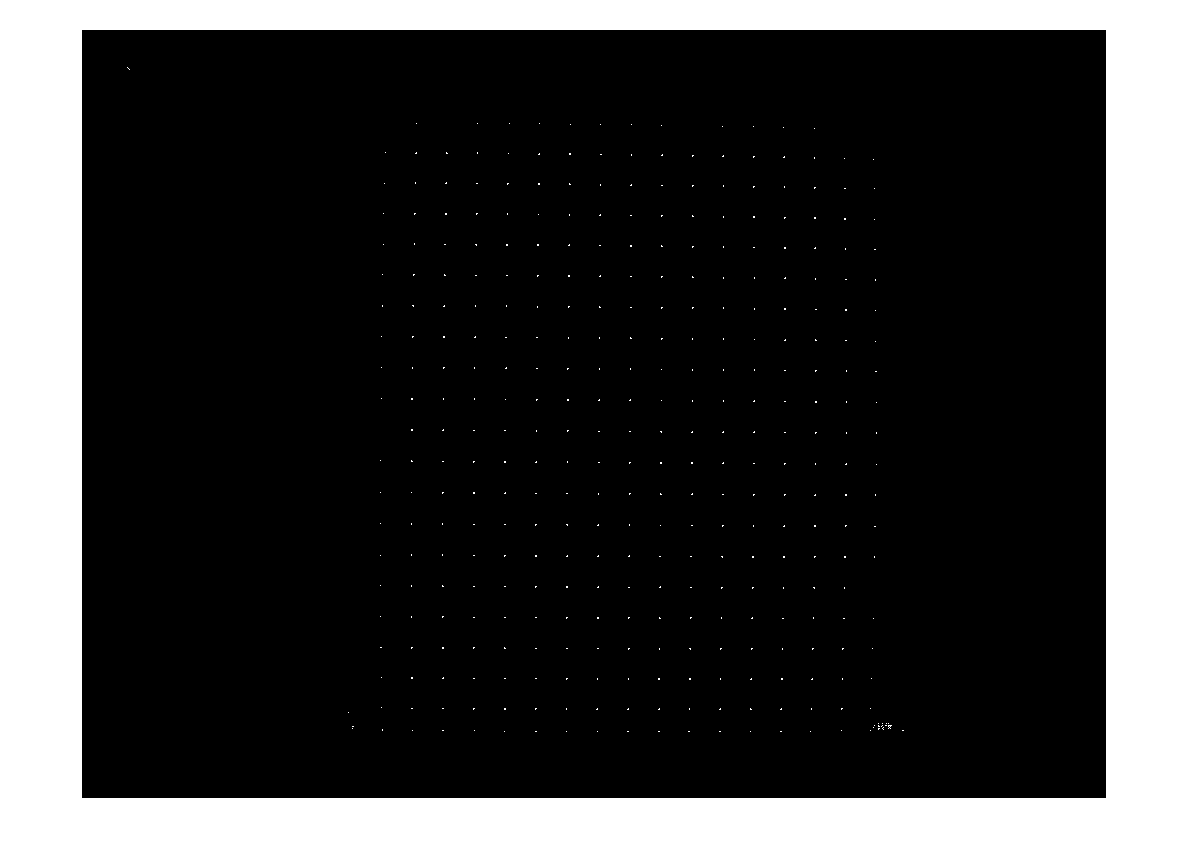
mask = and(r,b);
imshow(mask);
calculate vertices
sz = size(im);
xloc = ones(sz(1),1)*(1:sz(2));
yloc = (1:sz(1))'*ones(1,sz(2));
idx = find(mask(:)>0);
xcen=xcen(:);
xloc=xloc(:);
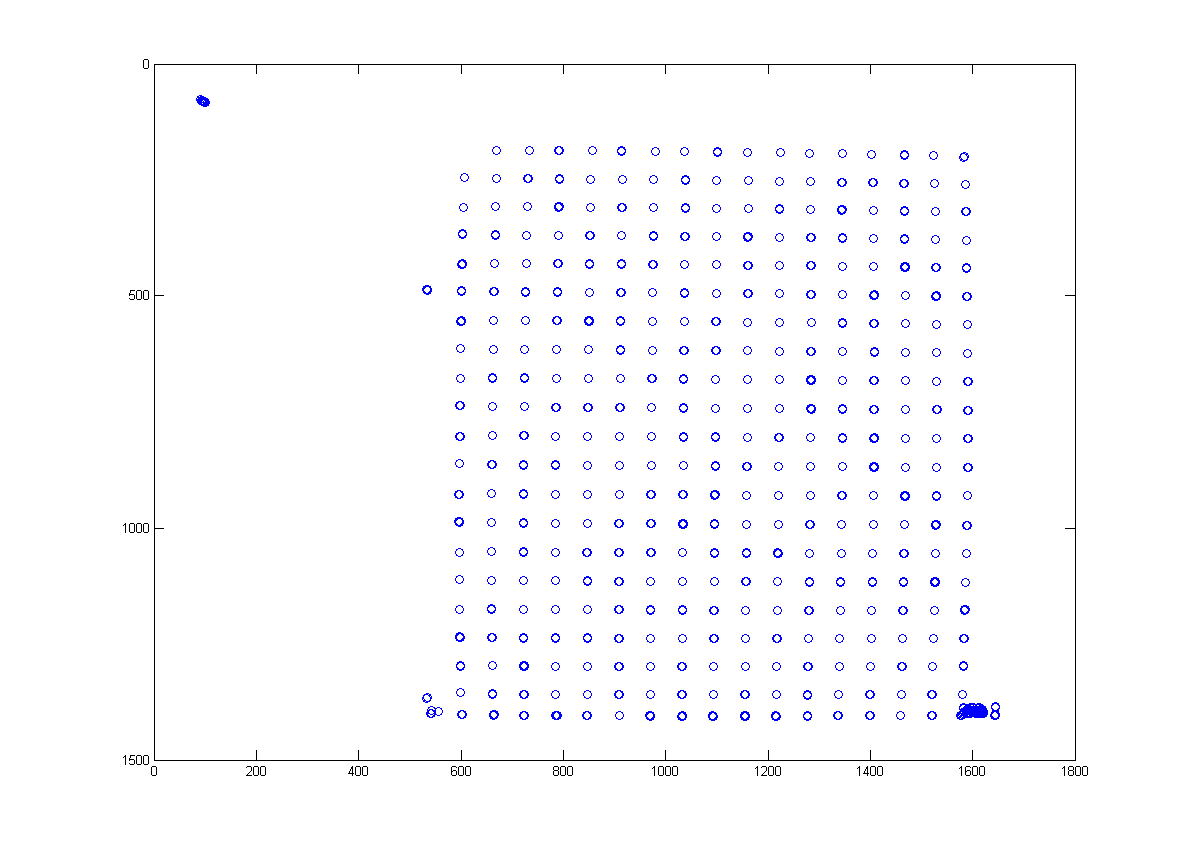
xpt = xloc(idx)+xcen(idx);
ycen=ycen(:);
yloc=yloc(:);
ypt = yloc(idx)+ycen(idx);
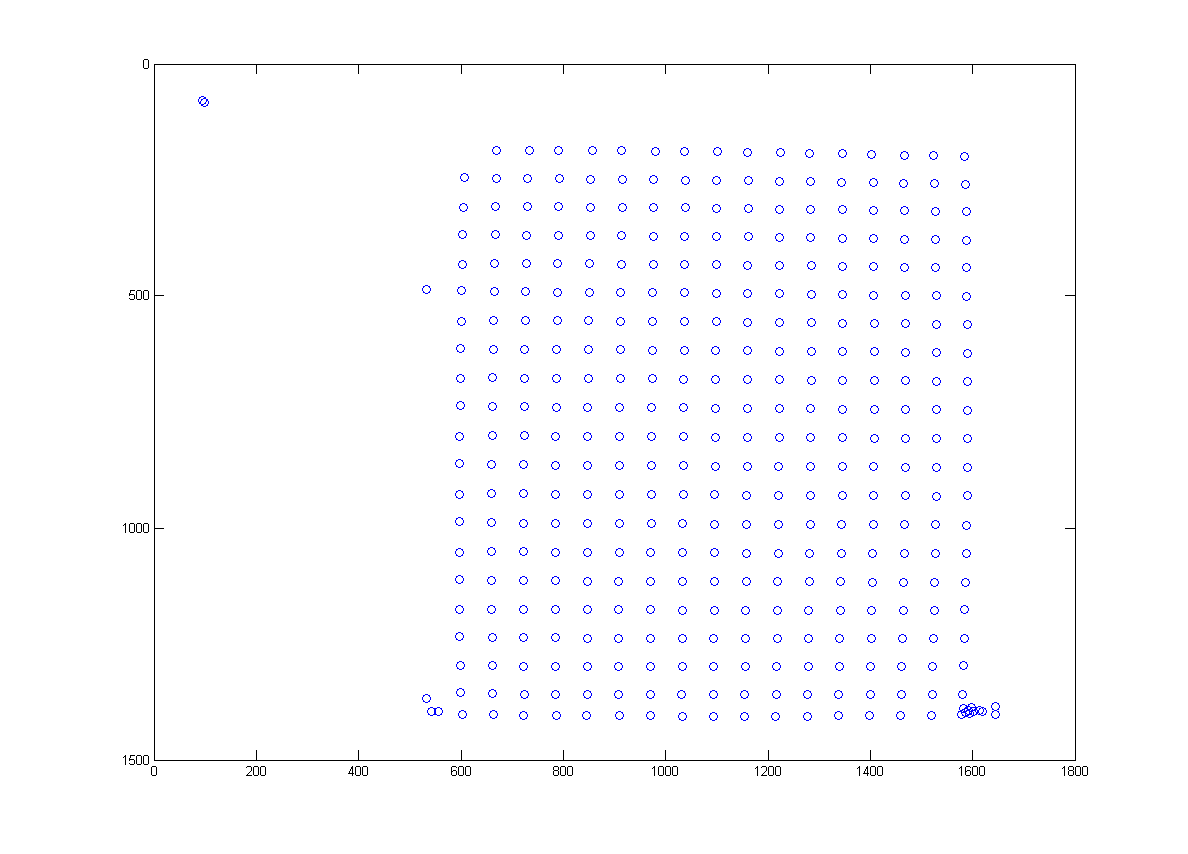
plot(xpt,ypt,'o');
axis ij
sort vertices
k = 0;
xw = xpt;
yw = ypt;
clear xc yc
while ~isempty(xw)
test = (xw-xw(1)).^2+(yw-yw(1)).^2;
[tsort idx] = sort(test);
xw = xw(idx);
yw = yw(idx);
idx = find(tsort<64);
k = k + 1;
xc(k) = mean(xw(idx));
yc(k) = mean(yw(idx));
idx = find(tsort>64);
xw = xw(idx);
yw = yw(idx);
end
plot(xc,yc,'o');
axis ij
show results (on image)
imshow(im);
hold on
plot(xc,yc,'x','LineWidth',2,'MarkerSize',10);
hold off
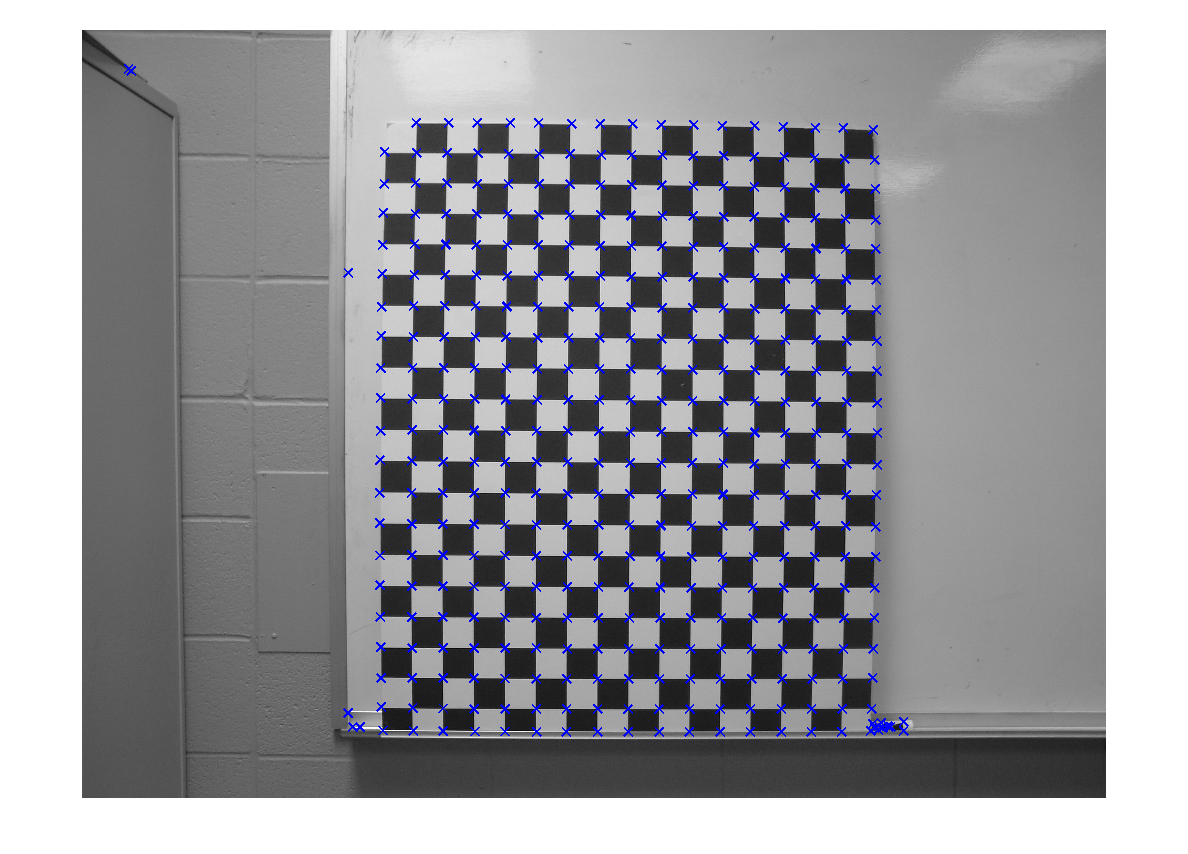
fprintf('size xc %d %d\n',size(xc));
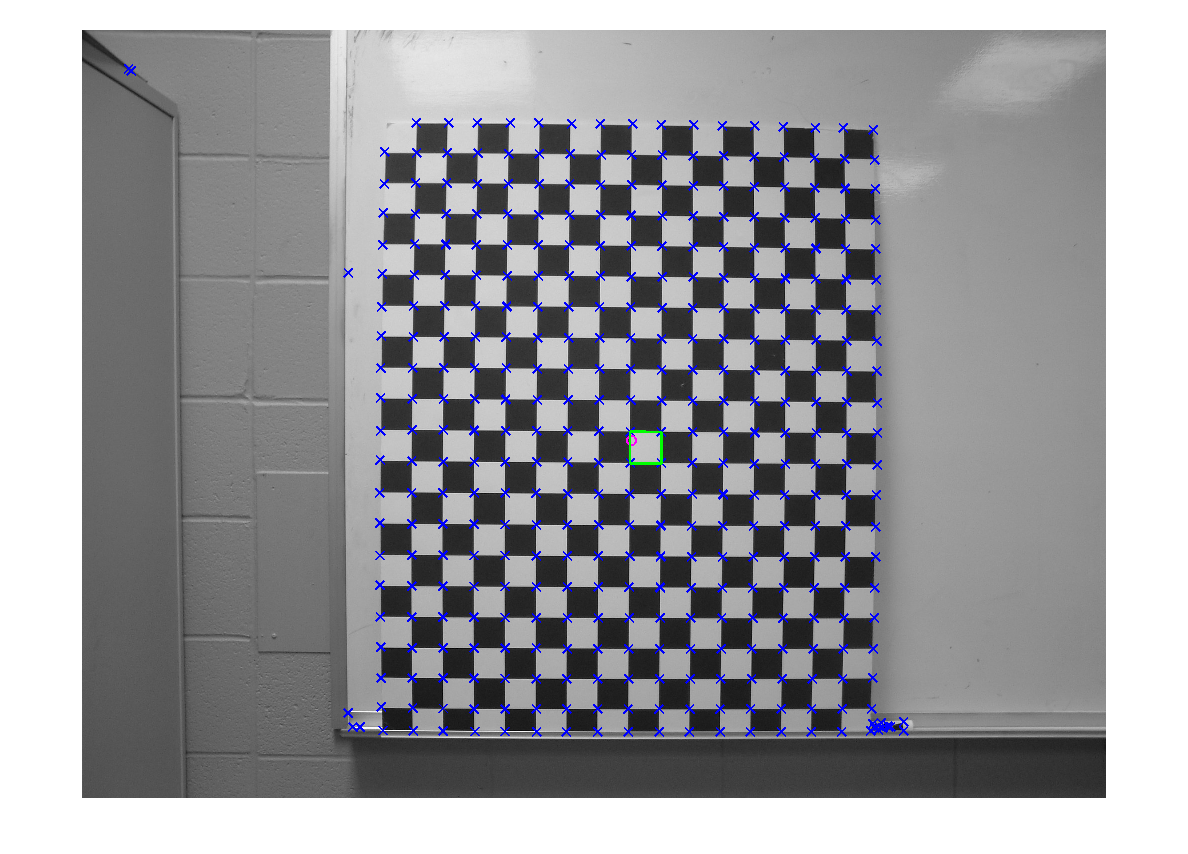
xcen = mean(xc);
ycen = mean(yc);
fprintf('centroid %g %g\n',xcen,ycen);
hold on
plot(xcen,ycen,'mo','LineWidth',2,'MarkerSize',8);
hold off
size xc 1 372
centroid 1099.56 821.558

distsq = (xc-xcen).^2+(yc-ycen).^2;
[tsort idx] = sort(distsq);
if m==3 || m==4 || m==6
idx(4)=idx(5);
end
idx = idx(1:4);
[xcorn nx] = sort(xc(idx));
[ycorn ny] = sort(yc(idx));
ndx = idx(ny);
xs = xc(ndx(1));
ys = yc(ndx(1));
u = [xc(ndx(2))-xs yc(ndx(2))-ys];
v = [xc(ndx(3))-xc(ndx(2)) yc(ndx(3))-yc(ndx(2))];
width = norm(u);
d = dot(u,v)/(width*norm(v));
if abs(d)>0.5
ndx(3:4) = fliplr(ndx(3:4));
end
v = [xc(ndx(4))-xc(ndx(1)) yc(ndx(4))-yc(ndx(1))];
height = norm(v);
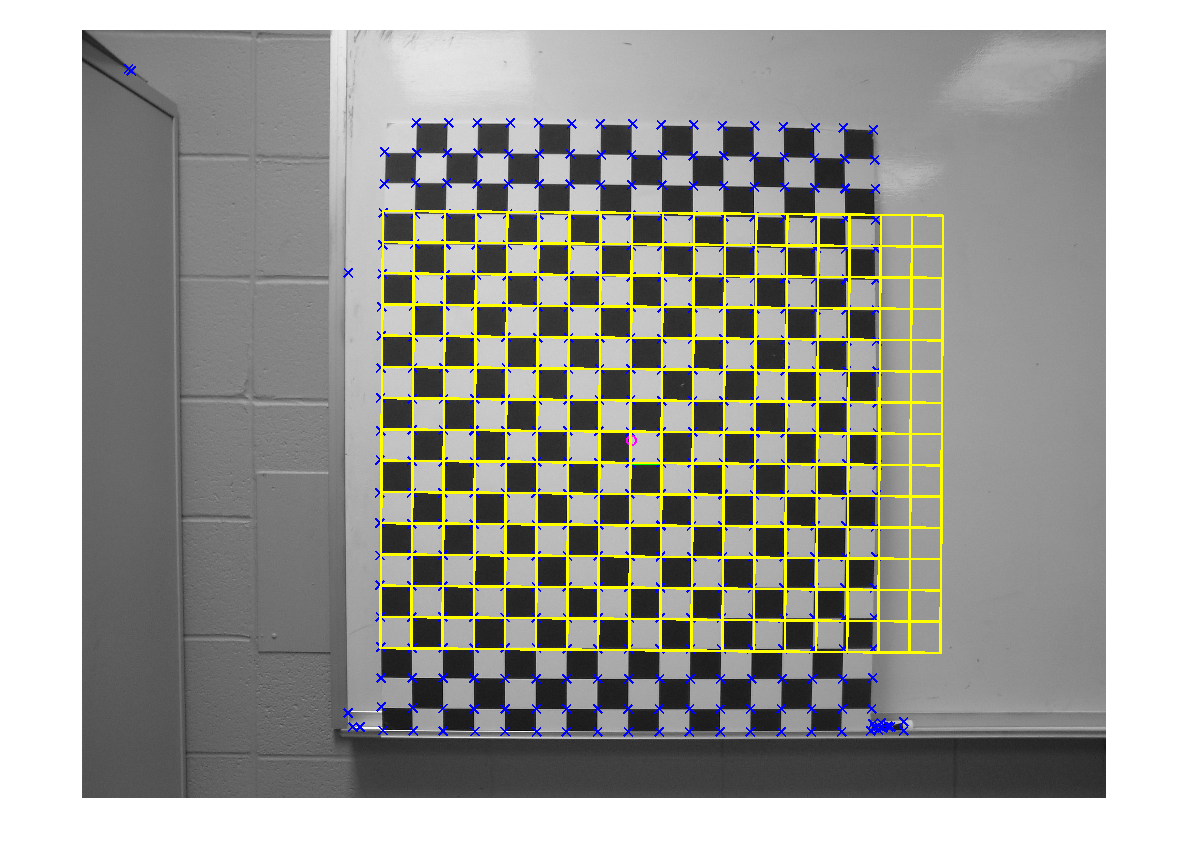
fprintf('width %g height %g\n',width,height);
fprintf('tilt %g degrees\n',atan2(-u(2),u(1))*180/pi);
ndx(5) = ndx(1);
hold on
plot(xc(ndx),yc(ndx),'g','LineWidth',2,'MarkerSize',8);
hold off
width 62.2417 height 62.4857
tilt -0.476613 degrees
drawgrid
sort points
widths
heights
center position
show results (on image)